Getting Started
Foreword
Usage metrics have been widely adopted in Open Access works as an indication of the popularity or acceptance of a particular publication. Inevitably, performance assessment and funding allocation is being based on these statistics. However, while we do not agree with these practices, we acknowledge that metrics collection and reporting is nowadays a fundamental need for any organisations producing and/or hosting digital monographs.
Thanks to their licenses, Open Access publications are disseminated across multiple platforms and repositories. However, publishers and distributing platforms simply collect usage data from their own system, due to the lack of public APIs that could allow programmatic collection of data from all the various websites hosting a publication. Most usage metrics available within distributing platforms display data for that particular website, not for the publication.
The software is designed to collect metrics from various sources and is divided into different sections, with the most prominent being the Metrics-drivers-wrapper which contains the packages called ‘drivers’. These drivers serve as entry point components, responsible for gathering data into the system. Following this, we have the ‘plugins’, which are used to normalise the collected data. Finally, the metrics are combined with the altmetrics and sent to the user interface, where they are displayed in a user-friendly Javascript widget.
As part of Work Package 6 of the HIRMEOS project Ubiquity Press and Open Book Publishers has developed open source software to allow collection and normalisation of third-party usage metrics, used to populate a database of title-specific data that allows its analysis and visualisation.
Simplified diagram
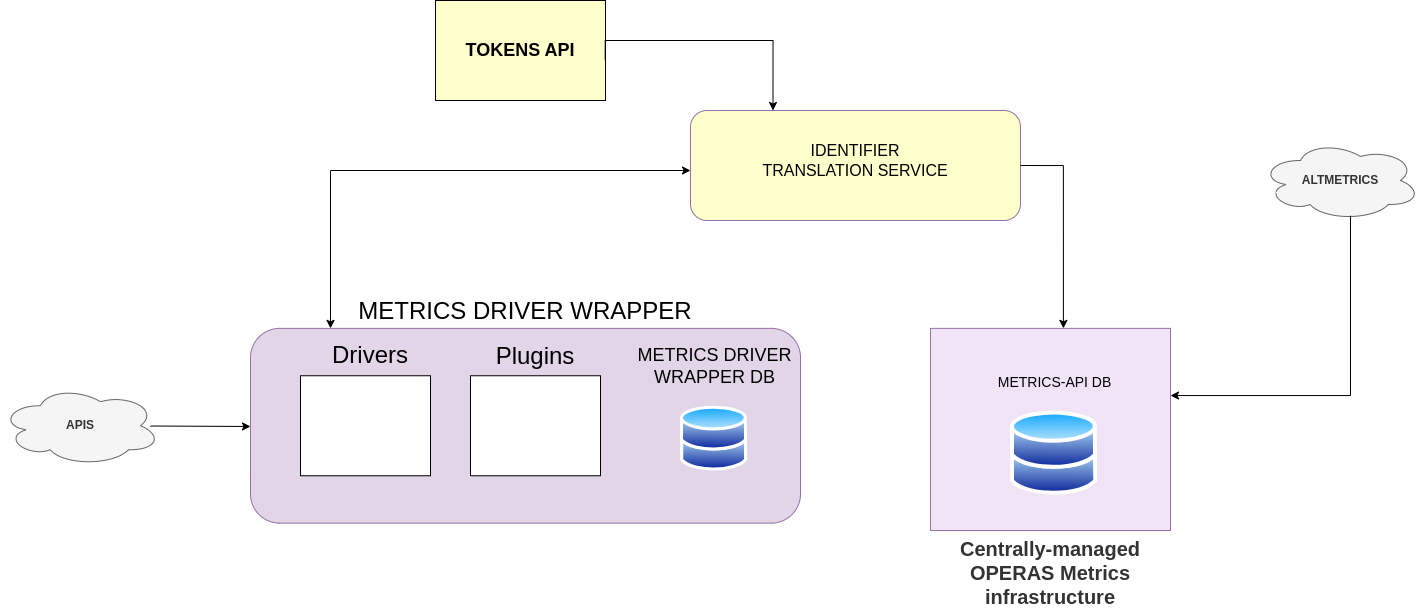
Components
The HIRMEOS metrics suite is made of:
- Metrics-drivers-wrapper. Repository where all drivers, plugins and config are found.
- Identifier Translation Service. Used to normalize identifiers. The Identifier Translation Service is a JSON REST API to a database of publication URIs; it maps works (publications) to URIs (e.g.
info:doi:10.11647/obp.0001,urn:isbn:9781906924010, https://www.openbookpublishers.com/product/3) to allow converting from one identifier to another. - Drivers. Used to collect and normalize data from reporting platforms.
- Tokens API. Used to generate JSON Web Tokens to authenticate all the various services.
- Countries API. Used by some drivers to normalize geographical data.
System requirements
Although every component involves has specific requirements, most of them will revolve around the following components:
* ensure that you are running a compatible version of Python, specifically Python >= 3.10; this version is required to ensure proper compatibility and functionality
* install the project requirements using the requirements.txt file; this will not only install the necessary Python packages from PyPI (including the drivers), but also meet the project's other dependencies
* finally, you need PostgreSQL database running on your system
How it works
This system is divided into different sections. Firstly, there are the drivers, which serve as the components responsible for gathering data into the system as entry points (refer to the point above to view the architecture diagram). In most cases, we connect to the source API to obtain the metrics, which is the preferred method. However, in two cases, we process a CSV file with metrics: 'Access Logs Local' and 'Google Books' (the latter is optional, as it can involve either web scraping Google Books or processing a CSV file uploaded by the user).
Next, we have the plugins, which are responsible for processing this data. Normally, each plugin corresponds to a driver, with the exception of 'JSTOR' and 'Access Logs,' which fetch the data individually. 'JSTOR' processes a user's CSV file, and 'Access Logs' performs a call to Google Cloud without any driver intervention. Subsequently, the metrics are saved to the database.
Last but not least, we have a second database that combines the metrics fetched by the drivers and plugins mentioned above, along with the altmetrics obtained from sites such as 'hypothes.is' and 'Wikipedia’, among others. Finally, these combined metrics are sent to the frontend for display in a widget..
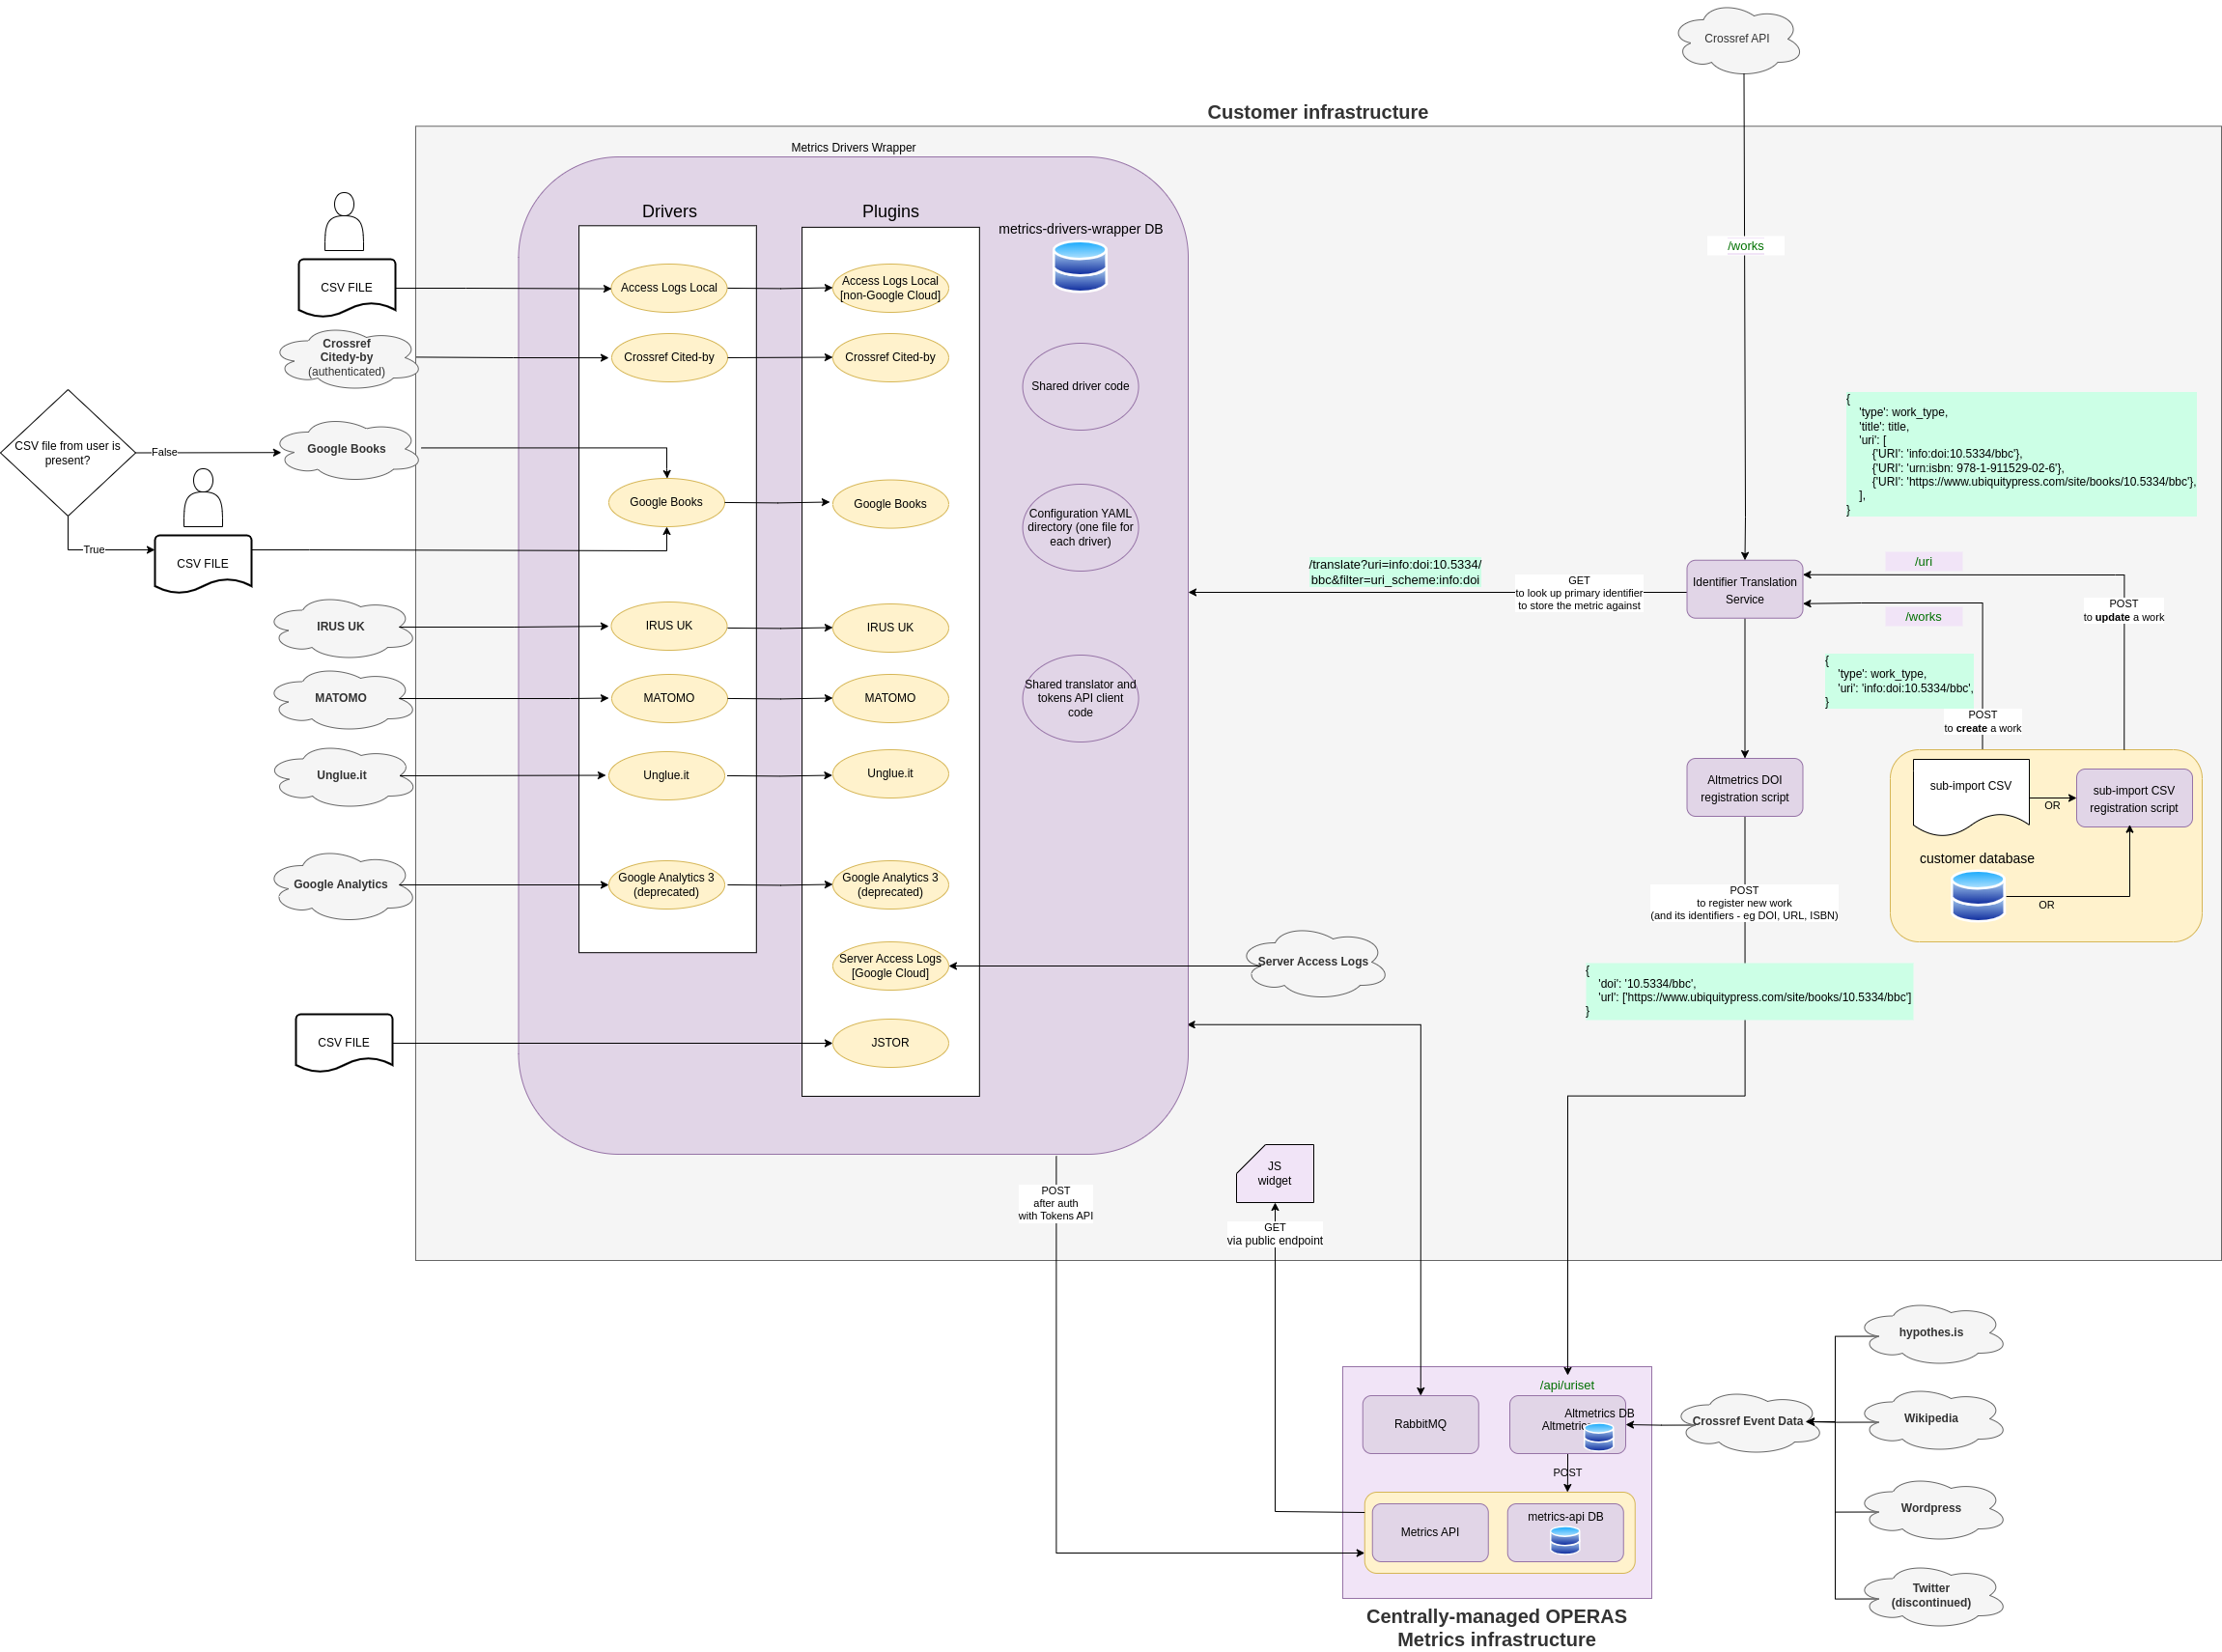
System architecture and diagram
See the diagram bellow for an overview of the different components and their interactions (click to zoom in):
More
You may find more information, including slides, here.
You may also get in touch with our technical team:
- Usage metrics: Javier Arias (Open Book Publishers)
- Altmetrics: Rowan Hatherley (Ubiquity Press)
- Metrics Drivers: Cristian Garcia (Ubiquity Press)